SBS to Anaglyph

Index

Explination

This program converts a single image with side by side left and right views Into an anaglyph (red blue) image by finding the best transformation to overlay them
using computer vision techniques from
simultanious localization and mapping,
structure from motion (3d view from video)
such as
edge detection,
maximum local feature detection,
correspondance matching
to automatically
align the images as best as possible

to generate an anaglyph from left and right images
what is acutally needed is the lens transformation for both images
is many image pairs with correlated features at different depths across the frames
then given the sbs lens doesn't move, the static transform can be found

this program doesn't do that yet
and is more of a test program for the feature detection and matching
functions that are planned to be the basis of a program library to transform
video and images into 3d objects and labeled components for video games and robots
to be able to understand and interact with the world
once it is working reliably with a stereo pair of a known translation
then it should be able to find the transformation between two video frames with static/fixed postion objects
and be used to generate a camera path in 3d and build a 3d pointcloud from feature points
Settings

Feature Correspondance Match Threshold

Max Number of Correspondence Sets

How many subsets of the corresponding features to generate and choose from

Feature Detection Pixel Variance Threshold

The amount a pixel in the edge detected downsampled image must differ from 127 (neutral gray) for it to be considered a feature

Max Vert Diff

The percentage of image height to search vertically for corresponding/matching features

Expected Horiz Diff

The percentage of image width to search horizontally for corresponding/matching features

Max Horiz Diff

The percentage of image width to search horizontally for corresponding/matching features

Num Times to Downsample before feature detection

1 or higher reccomended for performance and reducing pixel noise sensitivity, (this is the number times the image resolution is divided by 2), too low and memory and compute time may be too high

Input Image

Original Images


Luminance Histograms

The number of pixels of each intensity (total/luminance, r, g and b) in the image


Edge Detected Images

these images are similar to a normal map, 127/255 (gray) pixels
had no x or y pixel color variance to their adjacent pixels in the original image
red is the dx channel, green dy (delta(variance)) in pixel values
overlayed on this are outputs from the feature detection and matching steps
orange pixels are features that arent local maxima
black pixels are local maxima (highest variance of neighboring pixels)

Edge d(luminance)/d(px) Histograms

The number of pixels of each edge steepness (r (left right), g(up down) ) in the image


Detected Features

here the pixels (patches) of detected features are shown. During the correlation step, these are matched from the left to right images

Anaglyph (Red Blue) Combined Image


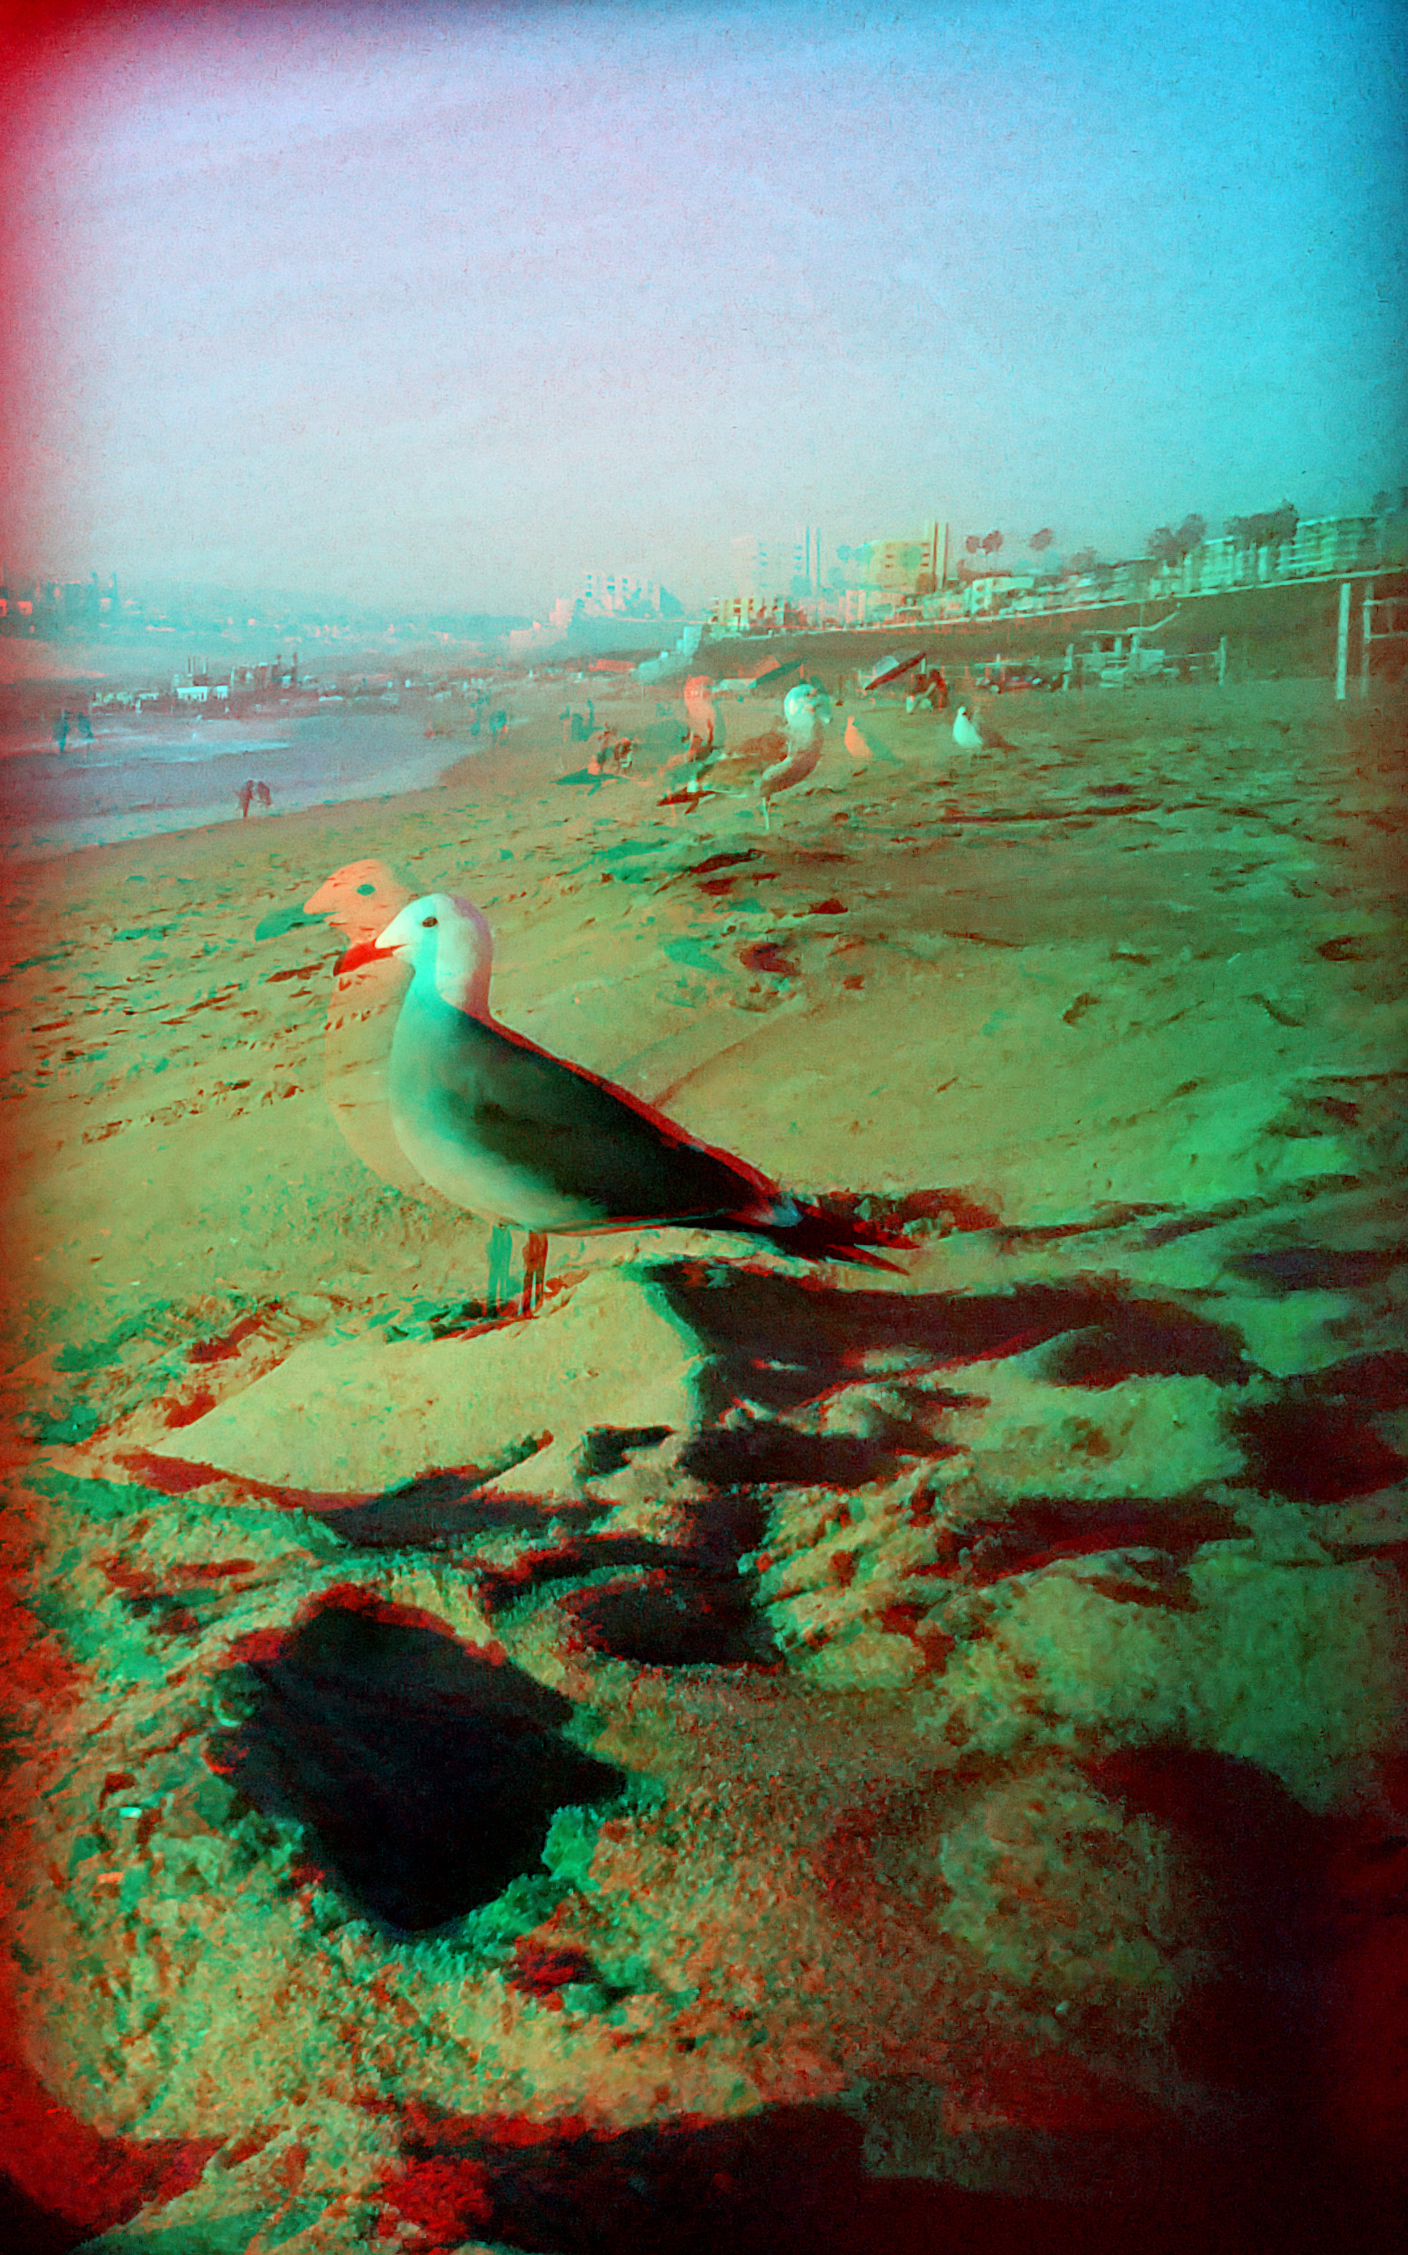
Example Result

Here is an example anaglyph output image from when the process works correctly


Tree Subdivision Log: